Deans/Department Chairs


Each term, GatorEvals provides faculty with an auto-generated interim report from GatorEvals opens in a new tab. The report is considered interim as some by Class Number and Aggregated reports might be available prior to all evaluations completing in a particular term. Official GatorEvals and historical GatorRater data is available through the university's reporting tool called Enterprise Reporting opens in a new tab. By policy, course evaluation data is available to faculty the day after final grades are due to students in ONE.UF. 

How to access GatorEvals and GatorRater Data

Request the Proper ARS Role

  1. To gain access to the Blue and Enterprise reports for faculty under your purview, please request one of the following SailPoint Security roles from your Department Security Administrator:
    • Deans - UF_COURSE_EVAL_COL_REPORT_VIEW
    • Department Chairs - UF_COURSE_EVAL_DPT_REPORT_VIEW
  2. Once approved, you will be able to log in to GatorEvals opens in a new tab and Enterprise Reporting opens in a new tab to view your reports. 

How to Access Data in Enterprise Reporting opens in a new tab

Please use the following navigation path to log in to view your GatorEvals and GatorRater data in Enterprise Reporting opens in a new tab:
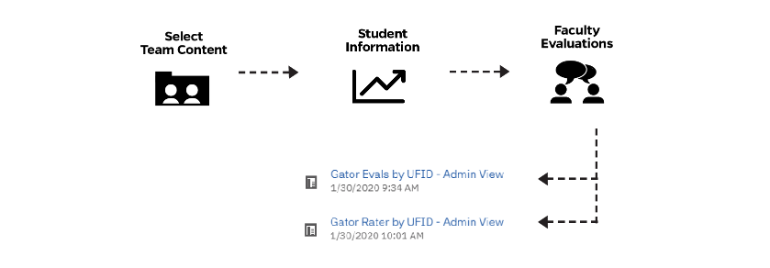
  1. GatorEvals Data - Admin View
  2. GatorRater Historic Data - Admin View

How to Access Data in GatorEvals 


College Dean Report Options

Type of report Description
College Report
  • This report offers views of college, department and faculty GatorEvals data, including heat maps for Core Instructor (Q3–Q8) and Course (Q9–Q12) questions. It also provides a detailed faculty-level results listed alphabetically by instructor and course with course-specific metrics and overall averages to support deeper review and action planning.
  • Green indicates higher-scoring areas that may inform teaching excellence and recognition (e.g., teaching awards and best practices).
  • Yellow and red indicate lower-scoring areas that may benefit from targeted department support or CTE (Center for Teaching Excellence) resources.
Department Report
  • This report provides a comprehensive view of GatorEvals data at the department level, combining student response distributions, comparative performance metrics, and instructor-level detail. It includes summary charts of student self-reported participation, Core Instructor (Q3–Q8) and Core Course (Q9–Q12) evaluation questions. Comparative tables display department mean and median scores alongside college and university benchmarks, with additional breakdowns by undergraduate and graduate courses (where applicable) to support deeper analysis.
  • The report also includes instructor-level results, listing faculty in alphabetical order. For each instructor, course-specific results are shown with heat map color-coding and overall averages, allowing departments to review individual performance within the broader context of departmental trends.
College Export Summary Report
  • This report provides a downloadable Excel file containing detailed GatorEvals data at the class number and instructor level. Data are organized by term, college, department, course, class number, and faculty member, with each row representing a specific course section. The file includes enrollment and response metrics (e.g., total enrolled, number of responses, and response rates), along with mean scores for Core Instructor (Q3–Q8) and Core Course (Q9–Q12) evaluation questions.
  • Faculty are listed by course and class number, enabling deans and administrators to review results at a highly granular level. Because the report is delivered in Excel format, users can sort, filter, and customize the data as needed for deeper analysis.
  • Colleges may also add calculated fields—such as Instructor Overall and Course Overall—using Excel formulas to support additional reporting, trend analysis, and decision-making.


Department Chair Report Options

Type of report Description
Department Report
  • This report offers views of department and faculty GatorEvals data, including heat maps for Core Instructor (Q3–Q8) and Course (Q9–Q12) questions. It also provides a detailed faculty-level results listed alphabetically by instructor and course with course-specific metrics and overall averages to support deeper review and action planning.
  • Green indicates higher-scoring areas that may inform teaching excellence and recognition (e.g., teaching awards and best practices).
  • Yellow and red indicate lower-scoring areas that may benefit from targeted department support or CTE (Center for Teaching Excellence) resources. 
Department Export Summary Report
  • This report provides a downloadable Excel file containing detailed GatorEvals data at the class number and instructor level. Data are organized by term, department, course, class number, and faculty member, with each row representing a specific course section. The file includes enrollment and response metrics (e.g., total enrolled, number of responses, and response rates), along with mean scores for Core Instructor (Q3–Q8) and Core Course (Q9–Q12) evaluation questions.
  • Faculty are listed by course and class number, enabling department chairs and administrators to review results at a highly granular level. Because the report is delivered in Excel format, users can sort, filter, and customize the data as needed for deeper analysis.
  • Departments may also add calculated fields—such as Instructor Overall and Course Overall—using Excel formulas to support additional reporting, trend analysis, and decision-making.


Individual Instructor Report Options

Type of report Description
Individual Instructor Aggregated Report
  • This report provides a comprehensive, instructor-focused summary of GatorEvals results across all sections of the same course/instructor for the selected term. It includes key summary metrics such as number of responses and response rates to provide context for interpreting results.
  • Detailed results are provided for the Student Self-Evaluation (Q1-Q2) questions, the University Core Instructor (Q3–Q8) and Core Course (Q9–Q12) evaluation questions. These include mean scores alongside departmental and college benchmarks, enabling instructors to compare their performance within a broader institutional context. Percentile distributions (percent responding at each rating level), along with summary statistics such as mean, median, and standard deviation, provide deeper insight into response patterns and variability.
  • In addition, the report includes open-ended student comments highlighting instructional strengths and areas that contributed to student learning.
  • The report also provides curated resources from the Center for Teaching Excellence (CTE), guiding instructors on how to interpret results and access professional development opportunities, consultations, and instructional support services
Individual Instructor by Class Number Report
  • This report provides the same detailed information as the Individual Instructor Aggregated Report but presents results separately for each class number (section) rather than combining them into a single summary view. Each section is reported independently, allowing instructors to examine student feedback at a more granular, course-specific level.


 [top]